How business intelligence tools can transform your business
There’s a constant flow of financial data within any business. The data paints a picture that’s accurate but also invaluable. The trick is to use it in a way that makes sense and isn’t a time-consuming task in itself. Business intelligence provides this trick. It’s all about taking the data and making it work for you […]

There’s a constant flow of financial data within any business. The data paints a picture that’s accurate but also invaluable. The trick is to use it in a way that makes sense and isn’t a time-consuming task in itself.
Business intelligence provides this trick. It’s all about taking the data and making it work for you in the easiest, most intuitive, and accessible way.
The concept originated in corporations back in the 1950s, but in recent years increasing use of technology has seen it trickle down so that even the smallest business can make use of it. On its journey downwards, the tools have become a lot simpler to use, yet no less valuable.
This article will show you how business intelligence can benefit your business and help you to stay on track using data.
Visualizing live data
The simple trick behind business intelligence is that it visualizes your live data, usually in reports or dashboards where the data is represented graphically. Most people are far better at comprehending data when it’s shown visually, rather than bare numbers, so this is useful.
Who hasn’t created a graph within a spreadsheet application? All that’s needed is to highlight a few columns of figures, then hit the graph icon on the toolbar and follow the steps. Hey presto, you get an instant bar graph or pie chart representing those figures.
Business intelligence is essentially this same process. For example, with just a few clicks you can transform your profit and loss ledger into a dashboard featuring a series of tables, charts, and standout figures. And, because the data comes from your accounting software, it’s always up-to-the-minute.
Visualizing the data brings a host of practical benefits:
- It’s easy for you to glance at, and understand, to get a quick yet complete picture of your business finances without too much mental exertion. The dashboard is always available, with no work required to “generate” it, so you’re always a click or tap away.
- It’s useful for sharing figures with senior members of staff, especially if colleagues have a habit of demanding figures ASAP.
- A departmental dashboard is useful for aiding colleagues who might want to understand the headline figures of another department, but who might not want to see the underlying data. For example, sales can view the headline performance figures of the manufacturing area in order to gauge upcoming production quantities.
Drilling down
A key feature of business intelligence dashboards is that they’re interactive. They’re not just there to look at! You can click a specific area in your graph or chart, and turn it into the focus. This might mean you’re presented with additional, more detailed information about what makes-up that figure or it might mean that the rest of the dashboard updates accordingly.
For example, if you sell across multiple geographies then selecting the sales figures for one region might cause the dashboard to focus on the sales and expenditures to reflect just that area.
This makes it incredibly quick and easy to explore data, and to get fresh insights and perspectives on your business. It makes it easier to spot areas of weakness, or to identify areas in the business that are performing above average.
Ultimately, it means you have more control and understanding—yet without the onerous requirement to comprehend a whole lot of data at once.
Time saving
The big benefit of business intelligence tools are not only in the visualization of real-time data. It’s also about saving time.
The big shock for many who start a new business is the sheer amount of admin work required. Sage recently undertook research that showed businesses worldwide estimate they spend 146 working days per year on admin tasks. 35% of those tasks were reported to be accounting related.
Anything that can help claw-back time from admin tasks is to be embraced—and using business intelligence does just that. It enables you to use your time more productively by removing the manual element of data analysis from your job.
Essentially, you’re free to do what you love—running your business with the insight to make the best possible decisions!
Wouldn’t you love being able to gain access to your top five expenses in a heartbeat while in the middle of month-end?
Four examples of business intelligence
The types of dashboards and reports used across businesses of all sizes vary but here’s some examples of the basic business intelligence dashboards that are typically used with smaller businesses.
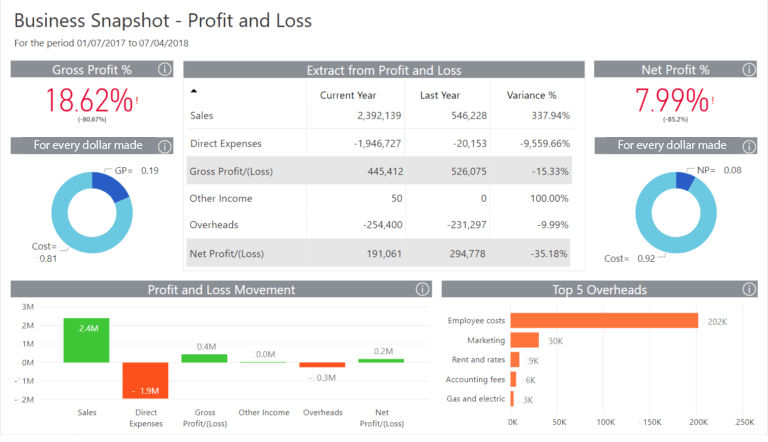
1. Business Snapshot
Wouldn’t it be great to have a visual summary of how your business is doing with regard to generating sales, managing expenses, and creating profits? A Business Snapshot dashboard can deliver this. It shows whether your business has made or lost money in the period under review, which can also help determine trends for future business decisions.
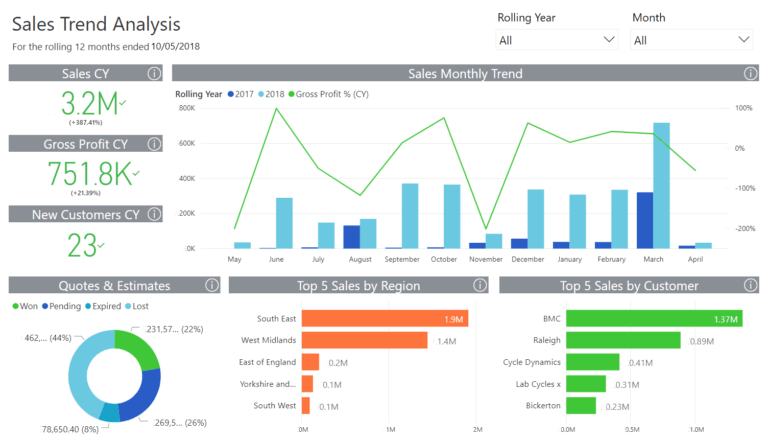
2. Sales Trend Analysis
All businesses desire a 360-degree view of their customers. A Sales Trend Analysis dashboard can show sales performance month-over-month or year-over-year, and can break down sales by region and customer, or by quotes and estimates. This gives you the vision to see where you are, where you were, and perhaps where you should be in order to create optimal growth.
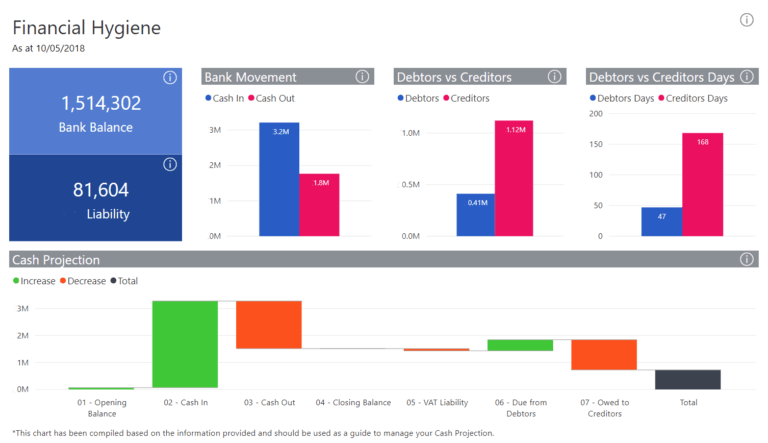
3. Financial Hygiene
Monitoring cash flow is an essential ingredient to the survival and success of any business. A Financial Hygiene dashboard gives an overview of cash transactions, so you can see at a glance how much is sitting in your bank account, what you’re due to pay out to the tax authorities (debt vs credit), and so on.
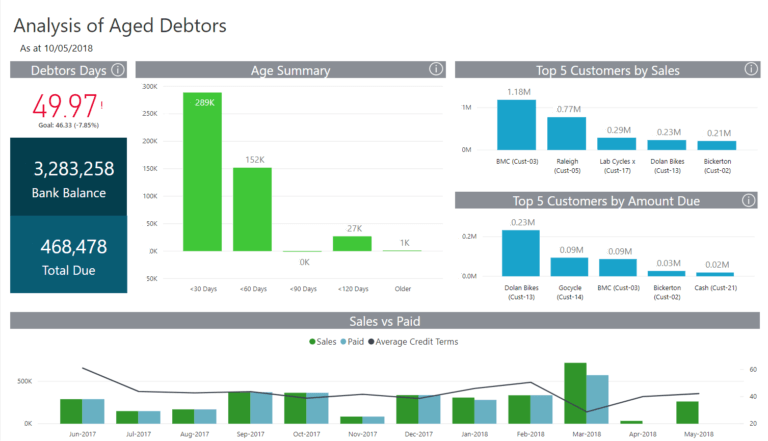
4. Analysis of Accounts Receivable
Who owes you cash and how much? When can you expect to receive it from overdue customers? This is what an Analysis of Aged Debtors dashboard can provide. Especially for younger businesses with tight cash flows, knowing this kind of information can be invaluable and might even mean the difference between bankruptcy and the continuation of the business.
Don’t be an incomplete business
Before you purchase business intelligence solution for your business, makes sure it ticks the following boxes.
1. One solution that connects to all your systems
A comprehensive BI solution that can access all your information with a seamless integration and visual representation of your activities will help you prioritize business initiatives and make solid, profit-making decisions.
2. Templates that are easy to understand
A robust BI solution will include out-of-the-box pre-set reporting features that help you hit the ground running with meaningful information. Dynamic and well-defined templates will help you deploy dashboards quickly and easily.
3. Self-service
A powerful BI tool should also allow customization or self-service feature. It transforms data into a stunning representation of your enterprise’s activities without the help of a technical expert. access anywhere, any time with mobile
Limited access to information leads to inefficiencies and even lost opportunities. Timely and easy access to your data translates directly into superior business performance.
4. BI security & collaboration
An empowering BI solution comes complete with authorization and restriction parameters that also affect data sharing. Control who should have access to what information.
Not having the right BI solution in place comes with a cost. It prevents you from working as efficiently and competitively as you should. The right BI solution for your needs takes the “scaries” out of the words data and technology and puts both to work for you.
Subscribe to the Sage Advice Newsletter
Get a roundup of our best business advice in your inbox every month.

Browse more topics from this article
Explore more wisdom

Accounting automation tools: The ultimate guide for accountants and bookkeepers
Learn how accounting automation tools can save valuable time during peak tax season.