4 ways your nonprofit financial reporting is broken (and how to fix it)
With the books closed on 2022, it is time to plan how to optimize your organization’s mission impact in 2023.

With the books closed on 2022, it is time to plan how to optimize your organization’s mission impact in 2023. As always, you will need to make the most of every dollar of funding, support your staff’s productivity, and develop new and better ways to deliver services. To put it another way, nonprofit CFOs need to declare their 2023 New Year’s Resolutions and then dig in to make change happen.
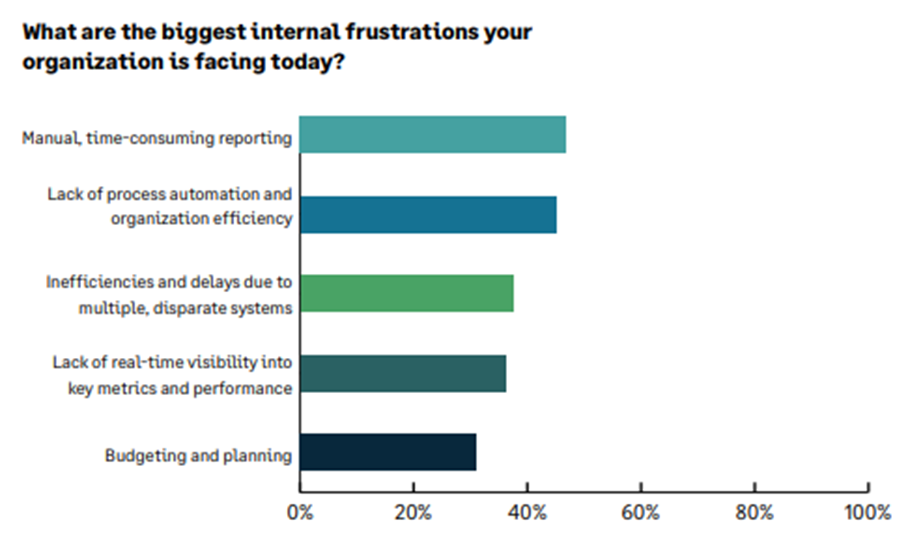
When asked about their organization’s biggest internal challenges for 2023, nonprofit finance leaders selected four top frustrations related to reporting and analysis:
- Manual reporting processes
- Lack of automation and efficiency
- Inefficiencies caused by disparate systems
- Lack of real-time visibility into key metrics and performance
2023 Nonprofit Technology Trends Report
All four of these areas impact the quality and efficiency of nonprofit financial reporting. Fortunately, all these challenges can be reduced or eliminated with the right nonprofit accounting software. In this article, we will examine four ways nonprofit financial reporting is broken and how a modern cloud accounting solution, can deliver more automated, efficient, and accurate reporting.
1: You’re relying on Excel for too much of your reporting
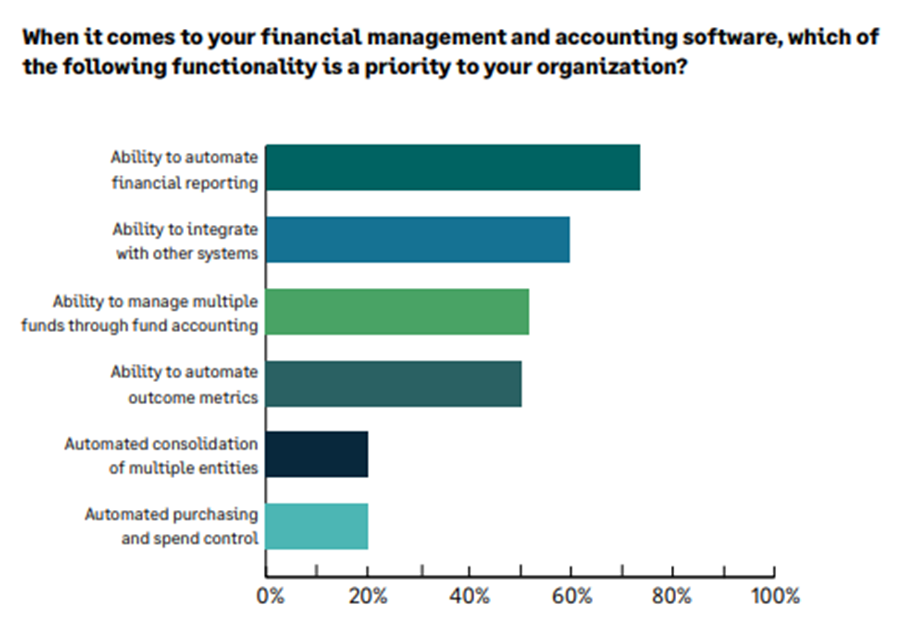
In the 2023 Nonprofit Technology Trends Report, leaders identified “manual, time-consuming reporting” as their top internal challenge. In fact, 72% of nonprofit finance leaders named the ability to automate reporting as the top functional priority for their organization’s financial management and accounting software—up from 63% in last year’s survey.
2023 Nonprofit Technology Trends Report
In general, nonprofits deal with far too many manual accounting processes. It is not unusual for the accounting team to pull information out of different business systems and spend hours—or days—manipulating data in Excel spreadsheets to create the financial reports needed by the organization. This is a highly inefficient use of the finance team’s time. By the time your team finishes reporting, the backward-looking analysis has often gone stale. Manual reporting in Excel is also susceptible to mistakes.
A good financial management solution provides automated reporting functionality from a single source of truth. For example, organizations using Sage Intacct have been able to close their books up to 90% faster by automating their financial reporting.
Another example is the success story of the Roman Catholic Diocese of Portland that highlights the efficiency of Sage Intacct church accounting software. Their finance team estimates that it has freed up about 10% of their time by streamlining manual processes, including report preparation, consolidations, accounts payable, and expense management.
By eliminating spreadsheets and moving financial information to the cloud, Sage Intacct enables your entire organization to benefit from real-time financial information about budgets, programs, fundraising, grant restrictions, staffing, expenses, and more. Built on a dimensional chart of accounts, Sage Intacct reporting makes it easy to slice-and-dice the data you need in just a few clicks. You will receive the exact reports you want without opening a spreadsheet.
“Reporting efficiency has leapt 75% since we deployed Sage Intacct. I can answer questions from managers in minutes, rather than needing two days to dig up information from QuickBooks and Excel. I’m doing more reports and I’m doing them faster with Sage Intacct.”
~ Romulo Lopez, Direct of Finance, Atlas Network
2: Critical data is stuck in systems that don’t talk to each other
If your accounting system does not offer easy integration to other business solutions, it can take extra time to complete reporting. You will need to export data from other systems and then import it to the accounting software. Sometimes, you have to rekey information manually. Often, data is only updated once per reporting period, making real-time analysis impossible.
Nonprofits with seamlessly integrated solutions do not have to spend time wrestling data between systems. They enjoy visibility across the organization at all times. The Sage Intacct Marketplace features best-in-class third-party business applications with pre-built integrations to Sage Intacct, so you can unlock the full potential of your data in the cloud. Sage Intacct also features seamless workflow integration with Salesforce.
As a result of easier integration, Sage Intacct reports and dashboards can include statistical data from other systems. This allows your decision makers to view outcome metrics (such as students served, meals served, animals adopted, etc.) alongside your financial performance KPIs.
“Sage Intacct dashboards have allowed me to just have more time to look at other areas of the organization where I can start building new reporting. I can start being what my role is, which is a CFO who looks through the front windshield, as opposed to a CFO who is always looking through the rear-view mirror.”
~ Ben Luety, CFO, Seattle Indian Health Board
You lack tools to transform reporting data into visualizations and insights
With the decision window for executives shrinking all the time, nonprofit leaders need real-time visibility into financial performance and outcomes metrics. Furthermore, executives and the board need data to be easily consumable—not 60-page spreadsheets to comb through line- by-line. Instead, information should be easy to consume so trends and insights can be highlighted easily.
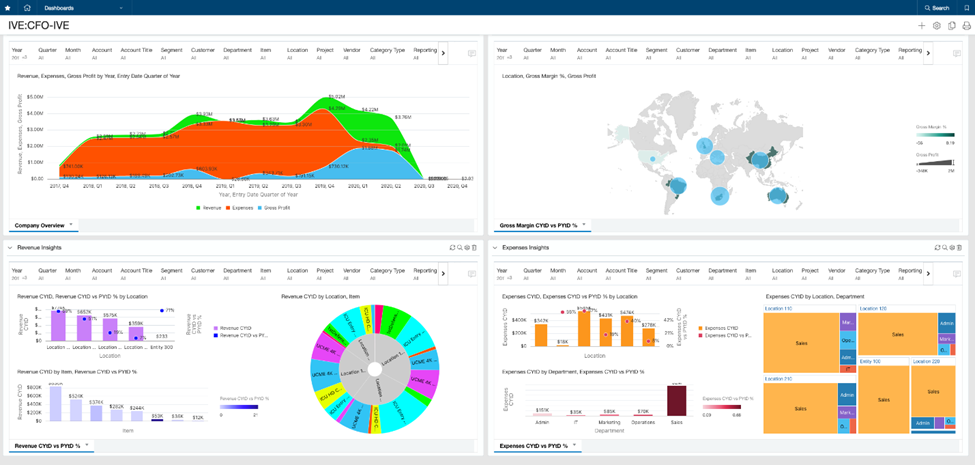
Dashboards in Sage Intacct, like this Sage Intacct Visual Explorer dashboard example, are completely customizable for your organization’s reporting and decision-making needs. Assemble multiple at-a-glance data visualizations, KPIs, and reports to enjoy the strategic, real-time visibility you need.
Real-time reporting with role-based dashboards empowers leaders to make better decisions informed by timely, accurate data. Trends and insights become much easier to spot with dashboards because you can arrange top-level views of several related reports side-by-side. You can also add nonprofit KPIs and charts.
Sage Intacct dashboards can be customized quickly and easily, so leaders can keep an eye on areas most critical for their roles. The finance team can easily create dashboards for board members, the CEO, CFO, department managers, and other roles. Because real-time data is presented, decision makers can start each day by studying their dashboards for a top-level view of any changes to the organization’s financial condition or outcomes. For even more predictive analysis, Sage Intacct Interactive Visual Explorer helps you explore your data interactively and speeds time-to-insights with more than 200 prebuilt data visualizations that you can view alone or as part of a dashboard.
“Our CEO and board of directors have recognized how valuable Sage Intacct’s real-time dashboards are to the organization because they increase our credibility and help executives better manage day-to-day operations. Rather than creating dozens of different reports for various departments, we can get the right information to the right groups by putting top-level reports on a dashboard, and letting the appropriate staff or volunteers adjust filters to see whatever region, department, or sub-cost centers they care about.”
~ Dave Teske, Director of Finance, Association of College Unions International (ACUI)
Automate reporting and focus on strategic priorities
As we have seen, nonprofit organizations with a modern cloud accounting solution, like Sage Intacct, benefit from real-time data visibility, reporting automation, seamless data connectivity between systems, and easy-to-understand data visualizations and dashboards. This results in more accurate reporting, better collaboration, and time savings. Automated reporting and dashboards deliver up-to-date insights that guide your board, executives, and other stakeholders with deeper insights. With more time available and better visibility, finance leaders can focus on strategic priorities and drive more mission impact. To learn more, please download the Achieving Real-Time Visibility with Nonprofit Financial Reporting and Dashboards eBook.
About the author

Nancy Master
Nancy Master is a senior nonprofit industry marketing manager at Sage Intacct, dedicated to providing solutions for nonprofits.
From accounting software for churches, community development, education, healthcare, governments to foundations and philanthropic organizations, Sage Intacct offers comprehensive tools to support mission success.
With over 15 years of experience in software marketing and nearly 20 years of experience working with a human services nonprofit organization, Nancy is passionate about helping nonprofits achieve their goals.
Subscribe to our Sage Advice Newsletter
Get our latest business advice delivered directly to your inbox.

Browse more topics from this article
Explore more wisdom

The essential SaaS business metrics every business should be tracking
From revenue and retention to acquisition and growth, tracking essential SaaS metrics is the key to driving business growth, improving decision-making, and staying ahead of the competition. Learn which metrics matter most—and how to track them effectively.