
There’s a constant flow of financial data within any business. The data paints a picture that’s accurate but also invaluable. The trick is to use it in a way that makes sense and isn’t a time-consuming task in itself.
Business intelligence provides this trick. It’s all about taking the data and making it work for you in the easiest, most intuitive and accessible way.
The concept originated in corporations back in the 1950s, but in recent years increasing use of technology has seen it trickle down so that even the smallest business can make use of it. On its journey downwards, the tools have become a lot simpler to use, yet no less valuable.
This article will show you how business intelligence can benefit your business and help you to stay on track using data.
Visualising live data
The simple trick behind business intelligence is that it visualises your live data, usually in reports or dashboards where the data is represented graphically. Most people are far better at comprehending data when it’s shown visually, rather than bare numbers, so this is useful.
Most of us have created a graph within a spreadsheet application. All that’s needed is to highlight a few columns of figures, then hit the graph icon on the toolbar and follow the steps. Hey presto, you get an instant bar graph or pie chart representing those figures.
Business intelligence is essentially this same process. For example, with just a few clicks you can transform your profit and loss ledger into a dashboard featuring a series of tables, charts and standout figures. And because the data comes from your accounting software, it’s always up-to-the-minute.
Visualising the data brings a host of practical benefits:
- It’s easy for you to glance at and understand, to get a quick yet complete picture of your business finances without too much mental exertion. The dashboard is always available, with no work required to “generate” it, so you’re always a click or tap away.
- It’s useful for sharing figures with senior members of staff, especially if colleagues have a habit of demanding figures ASAP.
- A departmental dashboard is useful for aiding colleagues who might want to understand the headline figures of another department, but who might not want to see the underlying data. For example, sales can view the headline performance figures of the manufacturing area in order to gauge upcoming production quantities.
A day in the life of business intelligence
“Through the visualisation of key trends, it becomes possible to catch issues before they become fatal problems, and opportunities before the chance to gain a competitive edge diminishes,” says Michael Amadi, founder and principal consultant of Nimble Learn.
Michael’s London-based company delivers training and consulting services to companies of all sizes, from startups to large enterprises, and has vast experience in seeing how business intelligence can benefit small businesses.
We asked him to describe a day in the life of a company using business intelligence to show how it can revolutionise processes and operations in terms of solving problems. Here, he uses the example of a small shoe supplier.
Sales summary report check
First thing in the morning you check your sales summary report on your business intelligence dashboard. The report summarises all sales activity across your shoe products, at both the item and product category levels, over the past 12 months. A line chart on the report indicates that one of your best-selling shoes has seen an abnormally high decline in sales over the past week.
Review reports
You click on the line chart and it takes you to another report that provides in-depth details about the shoes such as the number of sales by day, the number of returns by day and the average customer satisfaction rating by day.
Spot an issue
You notice the number of sales has decreased, the number of returns has increased and the average customer satisfaction rating has dropped from 98% to 61% all within the space of three days.
You review some of the negative feedback comments and notice a recurring theme: the soles of the shoes have been coming loose within a few hours of them being worn.
Solve the issue
You contact the supplier who in turn identifies the bad batch of shoes and agrees to replace them. You also decide to send out communications to the affected customers.
Four examples of business intelligence
The types of dashboards and reports used across businesses of all sizes vary but here’s some examples of the basic business intelligence dashboards that are typically used with smaller businesses.
1. Business Snapshot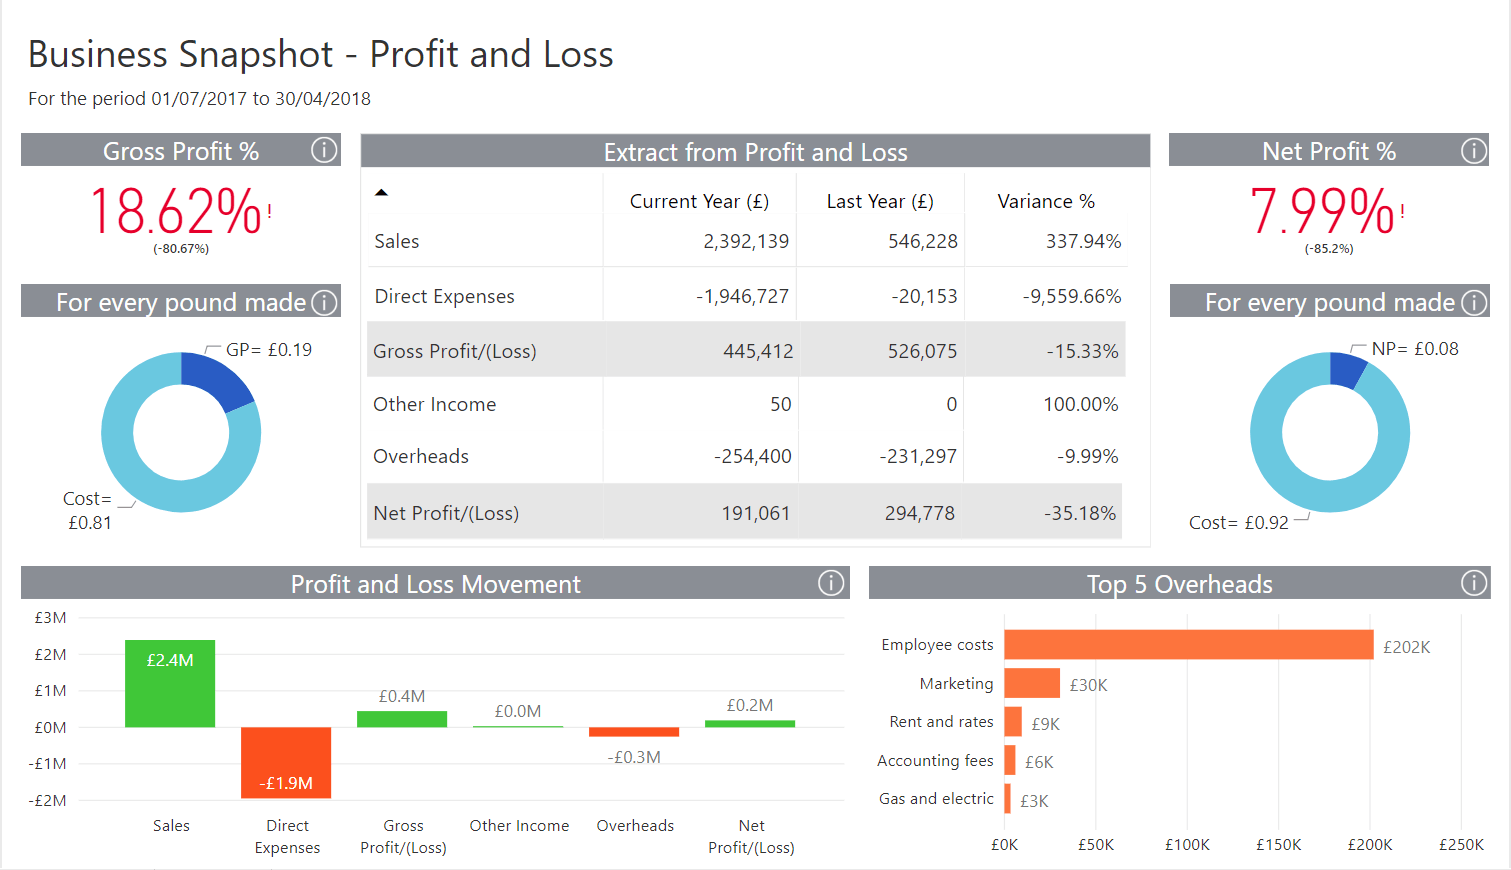
Wouldn’t it be great to have a visual summary of how your business is doing with regards to generating sales, managing expenses and creating profits? A Business Snapshot dashboard can deliver this. It shows whether your business has made or lost money in the period under review, which can also help determine trends for future business decisions.
2. Sales Trend Analysis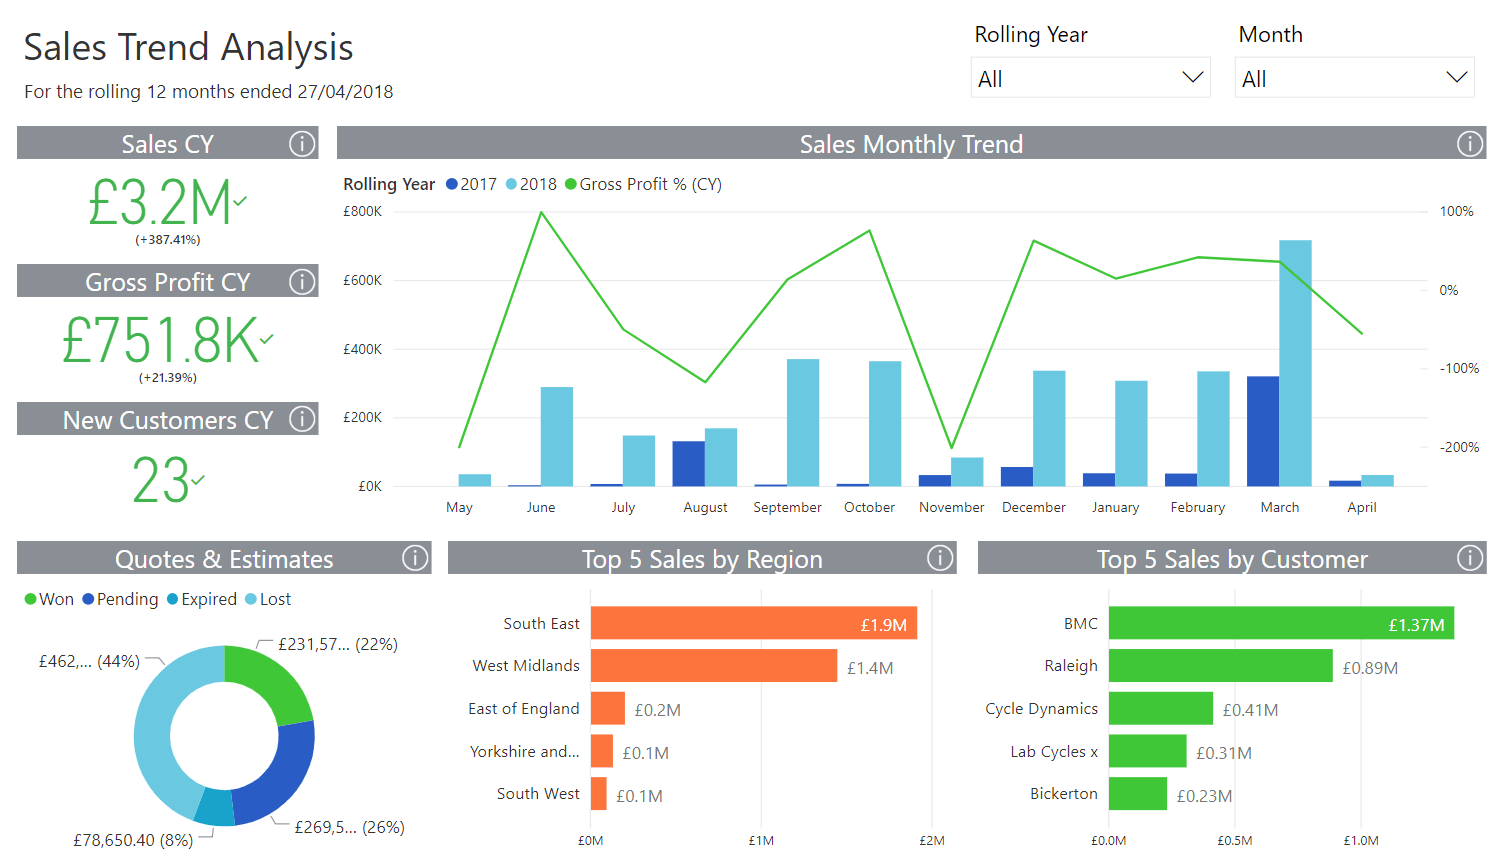
All businesses desire a 360-degree view of their customers. A Sales Trend Analysis dashboard can show sales performance month-on-month or year-on-year, and can break down sales by region and customer, or by quotes and estimates. This gives you the vision to see where you are, where you were, and perhaps where you should in order to create optimal growth.
3. Financial Hygiene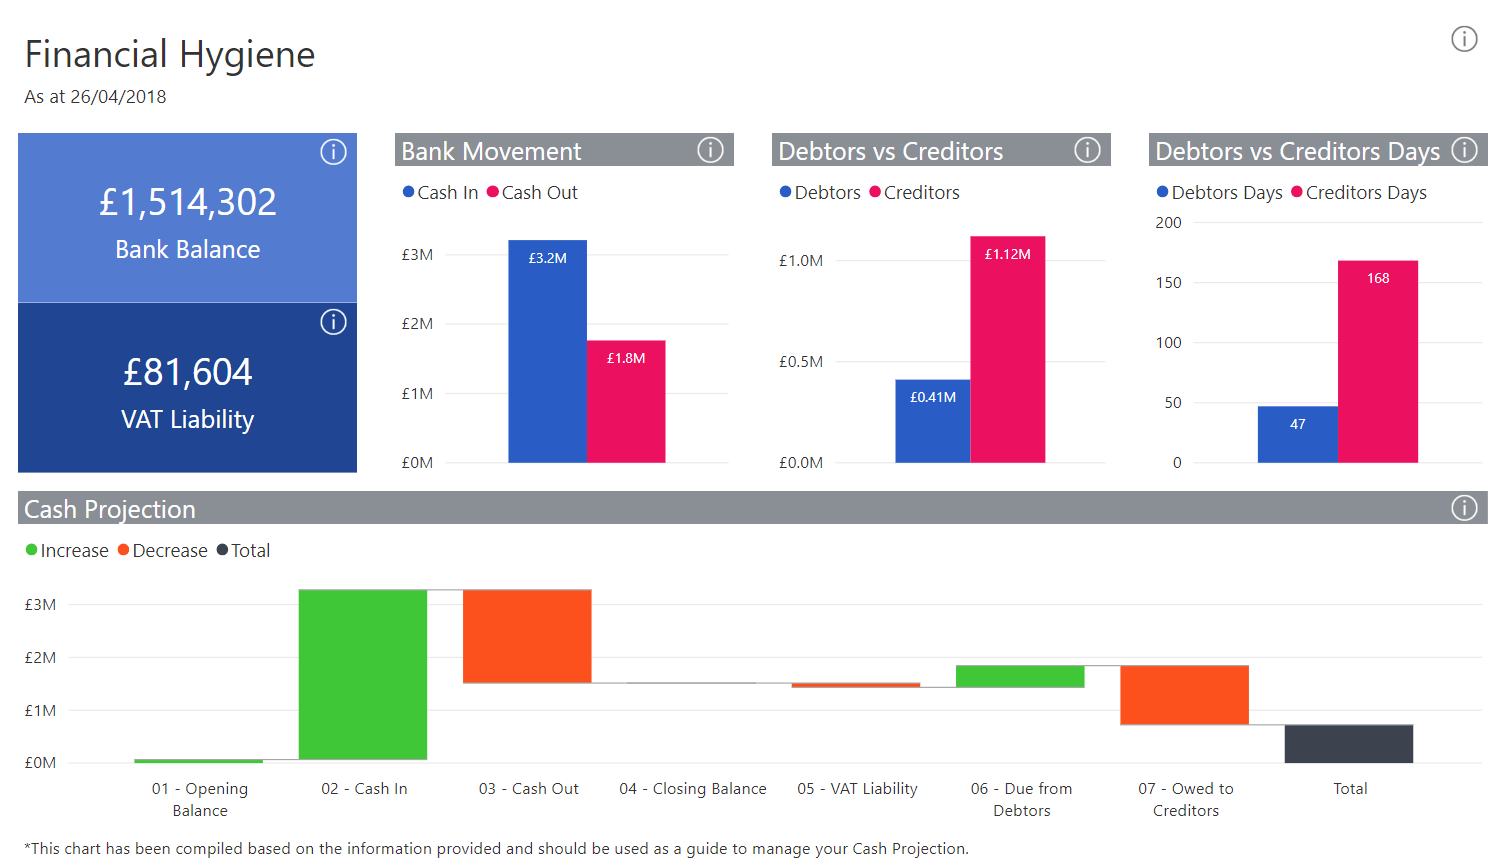
Monitoring cash flow is an essential ingredient to the survival and success of any business. A Financial Hygiene dashboard gives an overview of cash transactions, so you can see at a glance how much is sitting in your bank account, what you’re due to pay out to the tax authorities (debt vs credit) and so on.
4. Analysis of Aged Debtors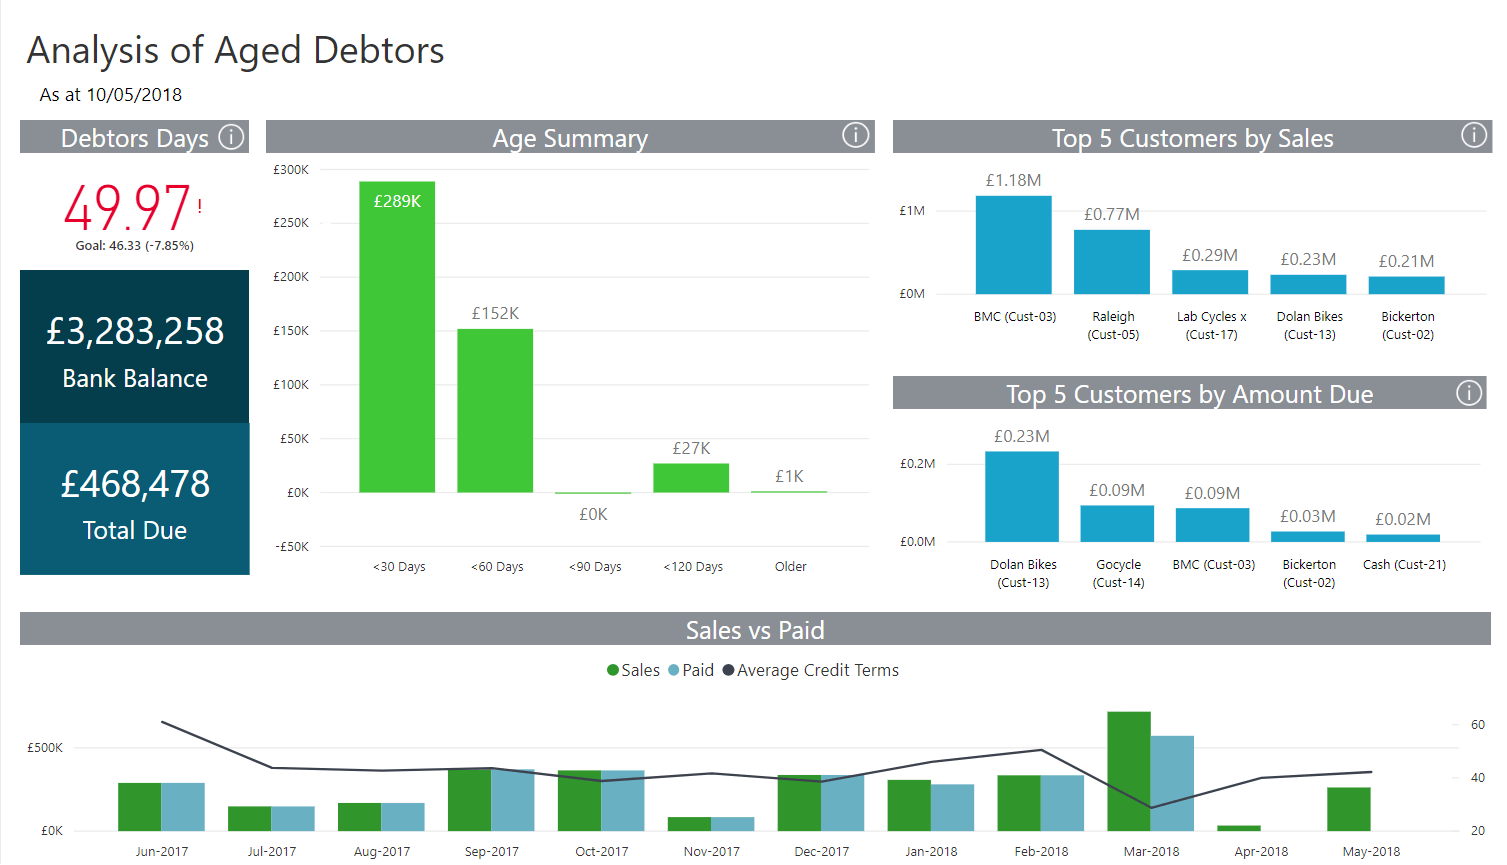
Who owes you cash and how much? When can you expect to receive it from overdue customers? This is what an Analysis of Aged Debtors dashboard can provide. Especially for younger businesses with tight cash flows, knowing this kind of information can be invaluable and might even mean the difference between bankruptcy and the continuation of the business.
An incomplete business
Technology is often considered indispensable in business, to the extent that all companies owe it to themselves to ensure they keep up with the latest developments. Business intelligence technologies such as dashboards essentially raise the technological bar for the small business sector, and provides a fresh new way to work with the increasing amounts of data that all businesses generate.
The benefits range from basic efficiencies to being able to get insights that were previously unheard of at this level of business size.
Can a small business be called incomplete if it doesn’t benefit from the likes of financial dashboards? Probably not, but the technology is so easy to use and so easy to implement that there really can’t be an excuse for not embracing it.
A basic guide to interactive dashboards for small business
Want to know how to use data to make the right decisions so you can grow your business? Download this free guide and learn how business intelligence tools can reveal insights that will keep your business moving.

Recommended Next Read

From chatbots to visionary generative AI-powered productivity assistants


Ask the author a question or share your advice